Floating World: A Tent City for Displaced Human and Bird Song
Home
Nature of Cities On-line Journal
Map
Artwork
Video_Floating_World
Statement
Introduction
Public Art-Barbara Goldstein
Sound Scapes
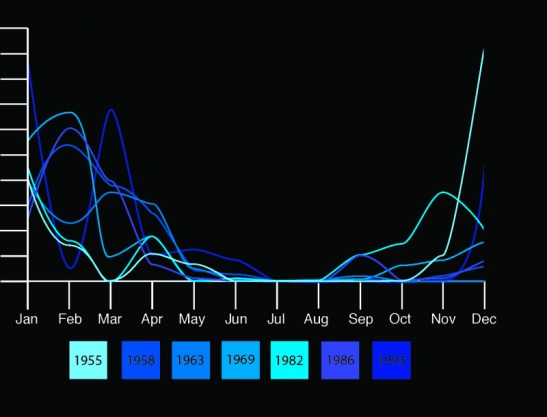
Precipitation + SJ Flood graph
News
catalog
Flood Video
Rendering
Fly By Installation Video
Encampment Support Structure
Process and installation progress
Mechanical Drawings/Text
Engineer's Drawings
Cal Tran bridge drawing with guardrail and anchor system
Electrical
Lead Artists/Contact
Research/Resources
Comment
Precipitation graph, number of inches of rainfall, annually, during the 7 most severe flood years in San Jose. This data was utilized to filter the sound for the water composition broadcast in all the encampments, every five minutes.